CASE STUDY: I-65 DC FC CHARGER NETWORK
Charging is the business of tomorrow and will revolutionize the highways and streets of the future. Our plan and the strategy behind our chargers are optimized for profit and ease of rollout.
This case study was created to demonstrate the potential for an intraregional charging network optimized according to ADTC (average daily traffic count) data for maximum exposure.
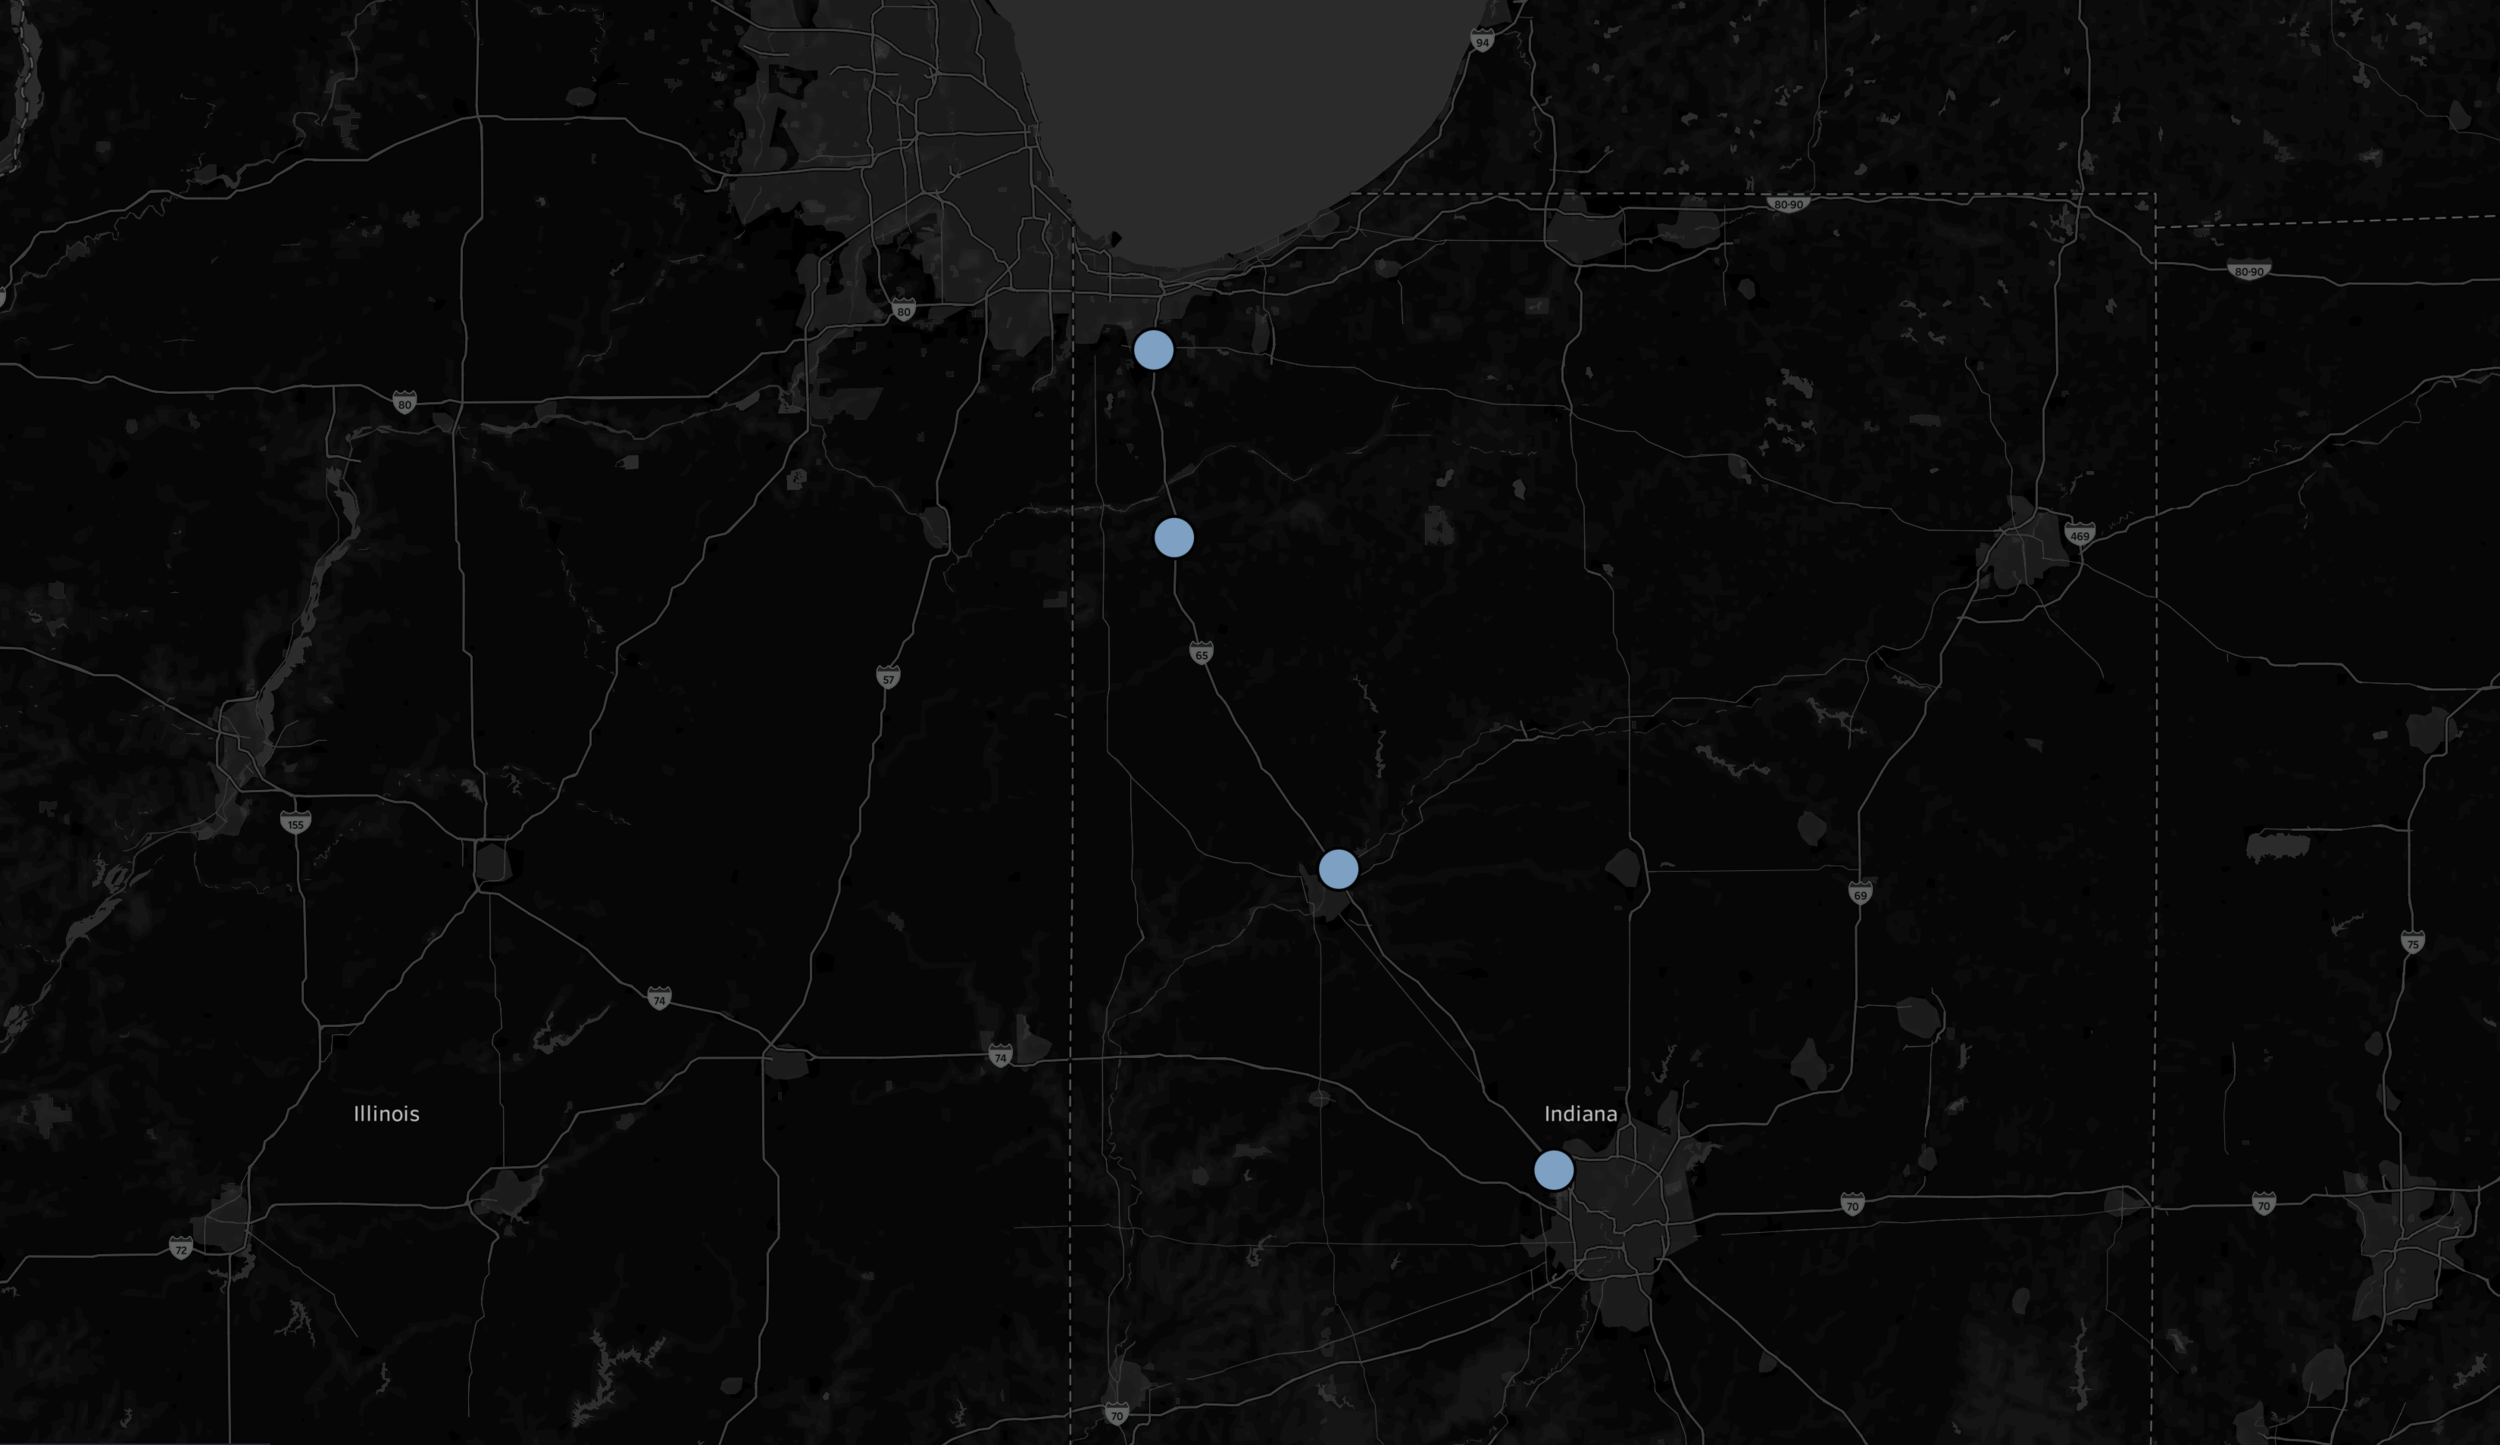
Daily traffic data was pulled from the Indiana Department of Transportation’s traffic count database. Data from 2020 was used to understand average daily traffic along various areas along I-65. Using this data, average utilization for chargers and EV vehicle count, and relevant growth estimates a model was created to determine the expected average daily charges for stations setup in the selected areas.
| Point | Avg Cars/Day |
|---|---|
| I-65 A (Merrilville) | 28,000 |
| I-65 B (MM 47) | 31,250 |
| I-65 C (MM 98) | 35,000 |
| I-65 D (MM 150) | 35,000 |
Traffic Data provided by Indiana Department of Transportation
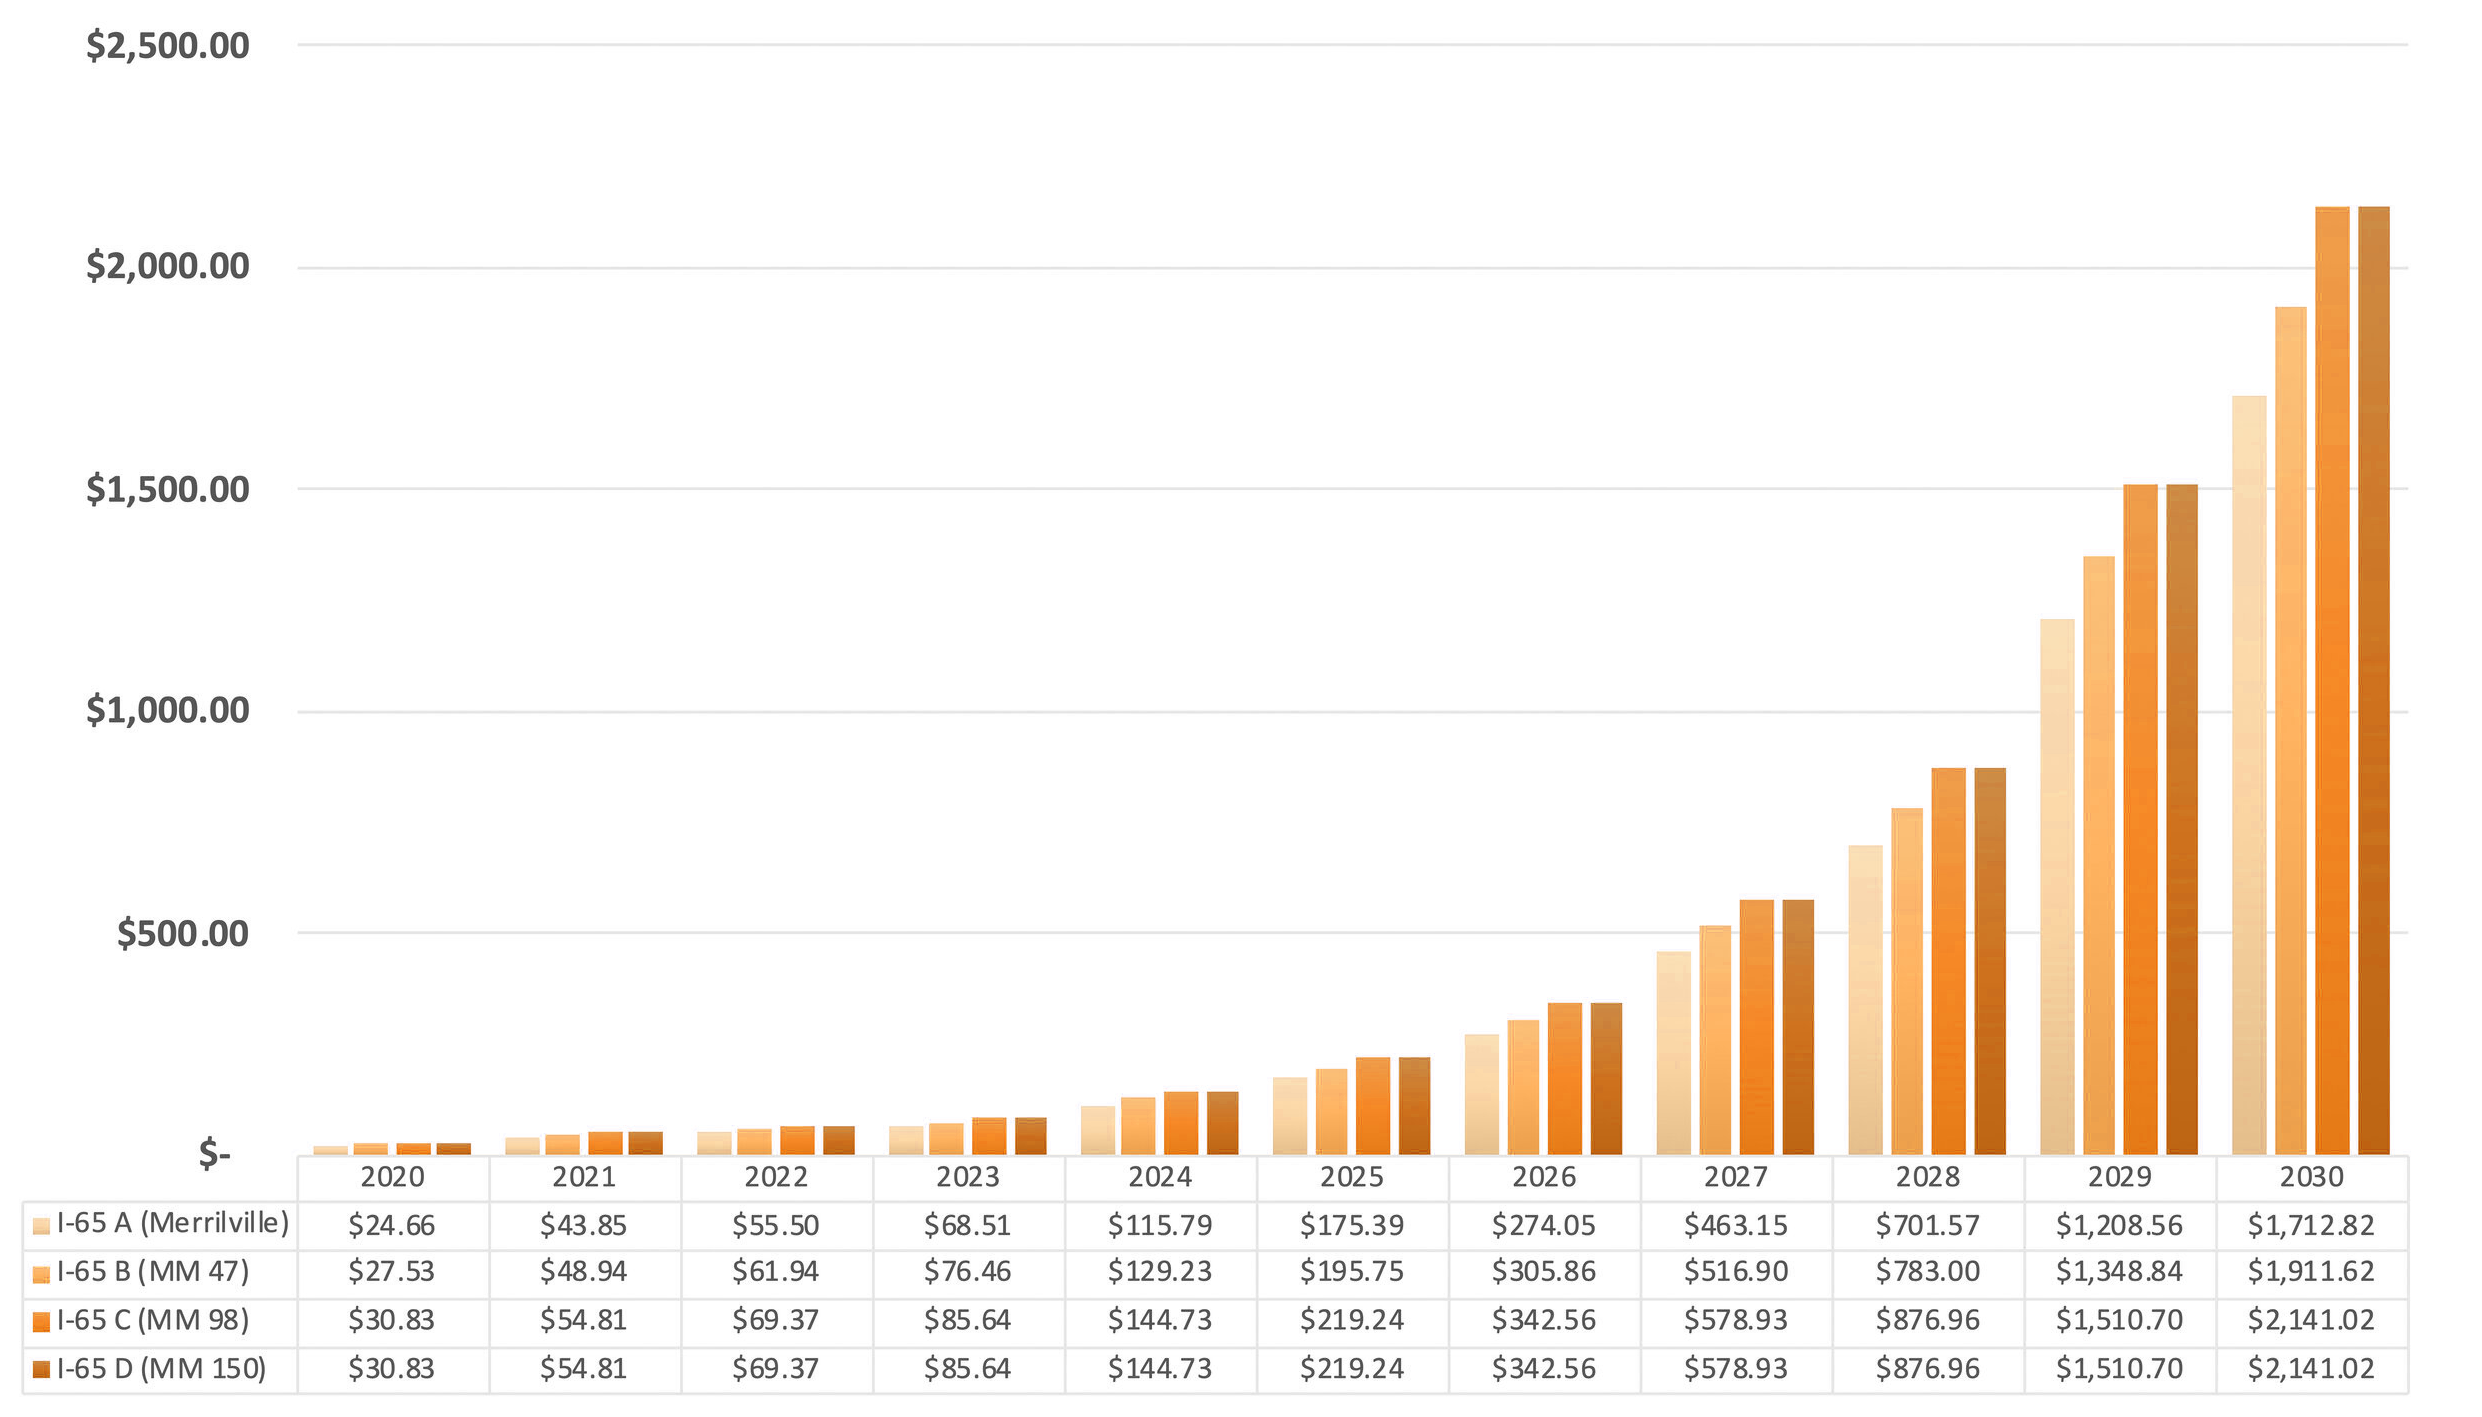
I-65 Charges per Day Forecast
Exponential Revenue Growth
Applying the business model and figures used in the previous section, we can create a forecast of the daily revenue per station over the next 10 years.
I-65 Daily Revenue Per Station Forecast